Cushing slips to 21.5 million, and our 18 September pass points back up.
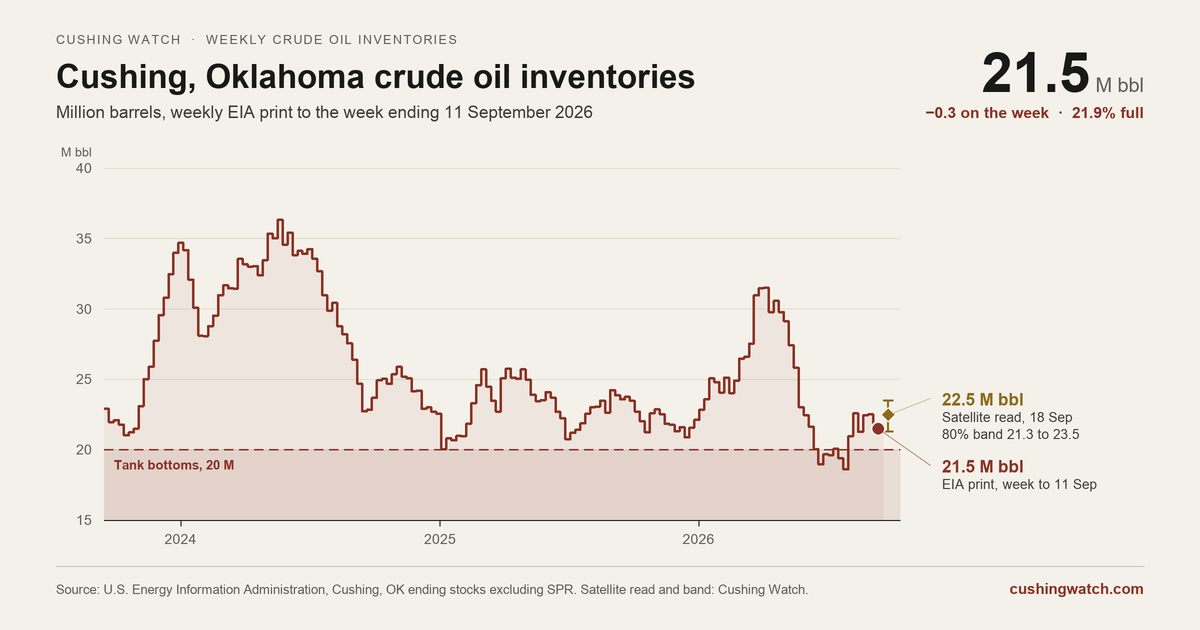
Tanks at the WTI delivery point closed the week to 11 September at 21.5 million barrels, a second straight draw that leaves the hub 1.5 million above the level the trade treats as tank bottoms. Our 18 September pass reads 22.5 million, a build of about a million barrels, five days before the EIA reports that week.
Seven weeks in a band, and a sharper satellite record
Cushing has printed between 21.0 and 22.6 million barrels for seven straight weeks, since climbing out of the 18.6 million low of the week to 24 July. This week's draw of 0.3 million, the second in a row, takes it to 21.5 million, 1.5 million above the 20 million floor and 2.1 million below the same week last year.
Our 18 September read of 22.5 million implies a build of about a million barrels, and the gain is concentrated in the southern half of the hub: in the twelve days since our previous pass, 53 tanks there rose by more than ten points of fill, against 35 that fell.
This week we re-measured the whole satellite record since 2018. Each tank is now located from its traced outline, and the reference that turns radar returns into a fill level was rebuilt for the southern tanks. The calibration is unchanged. Scored against every EIA print, the satellite-only read now errs by 5.8% on average, down from 6.7%, and the anchored estimate holds at 3.3%. Past weekly pages keep the figures they were published with.