Independent · No affiliation with EIA or CME EIA series W_EPC0_SAX_YCUOK_MBBL · Cushing Watch satellite estimate
Cushing Watch
Weekly crude oil inventories · Cushing, Oklahoma

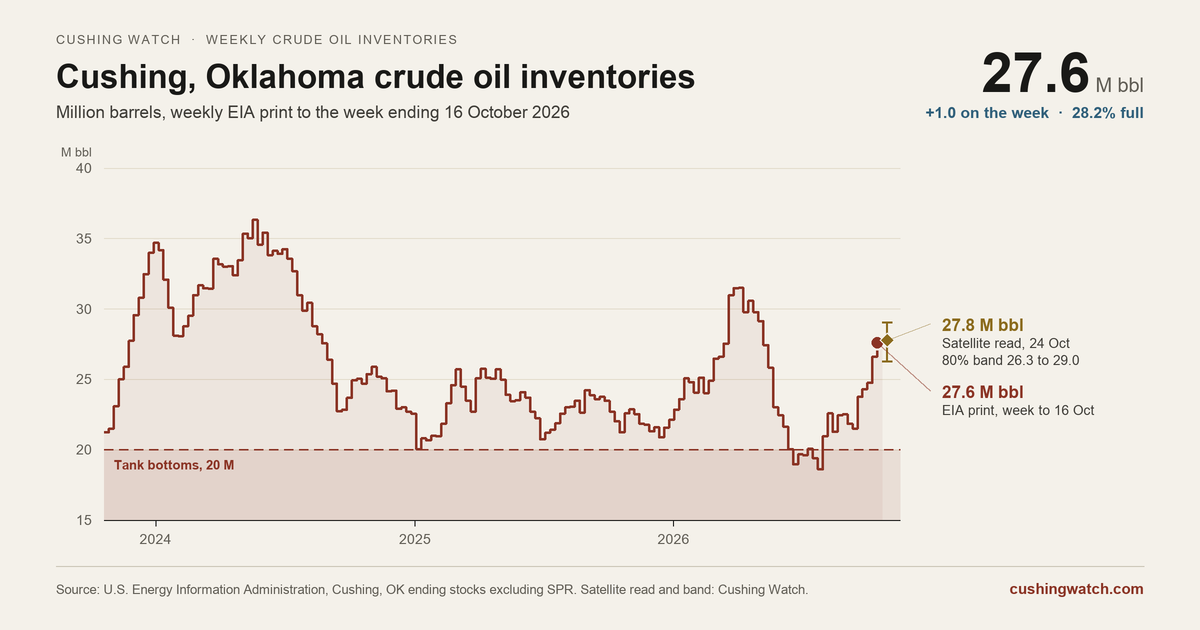
Cushing builds for a fifth week to 27.6 million, its highest since the start of May.

Tanks at the WTI delivery point closed the week to 16 October at 27.6 million barrels, up 1.0 million and 7.6 million above the level the trade treats as tank bottoms. Our 24 October pass reads 27.8 million, eleven days before the EIA reports that week.
EIA print published 21 October 2026 · Read written 25 October 2026
Crude in tank
27.6 M bbl
Week ending 16 Oct 2026
Change on the week
+1.0 M bbl
Fifth build in a row
Tanks filled
28.2%
Of 98 million bbl capacity
Against tank bottoms
+7.6 M bbl
Floor taken at 20 million
Our satellite read, as published that week
We measure 27.8 million barrels in tank on 24 October: 28.3% of capacity, and 0.2 million above the 16 October print. That pass falls inside the week ending 30 October, which the EIA publishes on 4 November. The print before it, for the week ending 23 October, lands on 28 October. Our 12 October read had put the hub at 25.5 million; the 16 October print came in 2.1 million above it.
27.8 M bbl
80% band 26.3 to 29.0
Satellite estimate · 24 Oct 2026
Chart of crude oil inventories at Cushing, Oklahoma, weekly over three years to the week ending 16 October 2026: 27.6 million barrels, against a 20 million barrel tank bottoms line, with the Cushing Watch satellite read of 27.8 million on 24 October.
Cushing, Oklahoma crude oil inventories to the week ending 16 October 2026. Source: U.S. Energy Information Administration; satellite read: Cushing Watch. Free to republish with credit to Cushing Watch and a link to this page. Full-size PNG
The read

A fifth build, and a miss on 12 October

Cushing took in 1.0 million barrels in the week to 16 October, its fifth build in a row. The hub has added 6.1 million since the week to 11 September, from 21.5 million to 27.6 million, its highest level since the start of May and 6.4 million above the same week last year.

Our 12 October read was a miss. We put the hub at 25.5 million and the EIA printed 27.6 million for the week to 16 October, 2.1 million higher and above the top of our 80% band of 24.1 to 26.7. We called a draw and the hub built by 1.0 million. It is our second miss in a row, and both came in low while the hub was building.

Our 24 October pass reads 27.8 million, with an 80% band of 26.3 to 29.0. That is 0.2 million above the 16 October print, so it points to a hub holding near this level rather than building at the pace of the past five weeks. The pass falls in the week to 30 October, which the EIA reports on Wednesday 4 November; the print for the week to 23 October comes first, on Wednesday 28 October.